Using production KPI dashboard excel templates is a simple and effective way to monitor all the important activities of a business. No matter you are calculating the production cost or creating an annual revenue report, KPI templates can help you manage every aspect of your business. Since creating a production KPI dashboard excel template could be a little techy and time-consuming for most users, we recommend downloading readymade KPI templates according to your business needs.
However, the internet has already filled up with irrelevant information and resources. So it will also be a tough task to find a perfect production KPI template that suits your business metrics. Don’t worry, here is the list of seven nest production KPI dashboard excel templates to level up your business and work productivity.
Top 7 Production KPI Dashboard Excel Templates Free Download
These KPI dashboard templates are mainly designed to use in Microsoft Excel and to track all the production metrics of your business. Also, these templates are simple to use and contain all important terms to finish your business reports effortlessly. Moreover, a moment of research is a must to get a clear vision about specific metrics you want to follow in your business.

So without wasting much time, check our handpicked collection of production KPI dashboard Excel templates:
1. Weekly Production Report Template
Some business owners prefer to follow business activities on a weekly basis rather than monthly or daily. Here is a weekly production report KPI template especially for these kinds of business persons. This excel template is straightforward, easy to use, and store data of up to 52 weeks. All you need to do is input your data and select weeks to display. That’s it. Now you’re ready to analyze your business production details.
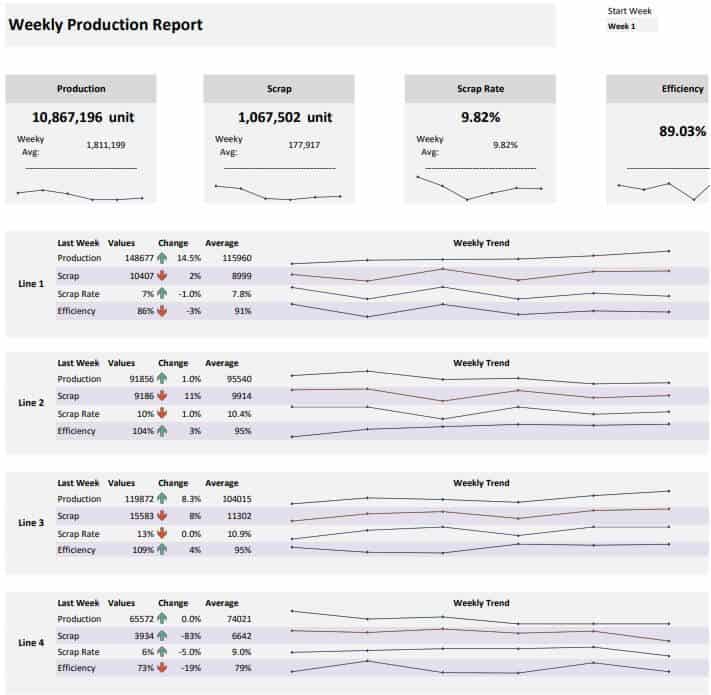
This production KPI excel dashboard comes with 2 sheets:
Data Sheet: Users enter the data on this sheet and it makes a direct effect on the report interface. whenever the user changes the line and the category names, the names and lines on the report interface will also be changed.
Report Sheet: This section shows the information and metrics about the weeks that the user selected in the dashboard. Users can easily adjust weeks from the upper right side of UI and also with the help of the calendar on this sheet.
Key Features
- Uncomplicated and easy accessible
- Eye soothing color scheme
- Able to show metrics of an individual day
- Fully custom editable fields
- Shows all weekly important metrics e.g. production units and scrap rate
Click here to download the Weekly Production Report Template.
2. Manufacturer Business Model (DEMO)
This is a DEMO model of the Manufacturer Business Model version. This KPI dashboard supports a well-organized tab system. For every different statement such as financial statements: Income Statement, Balance Sheet, and Cash Flow Statement, it owns a separate tab. In addition, this template contains a feature such as a negative cash balance that allows the user to adjust according to the required assumptions.
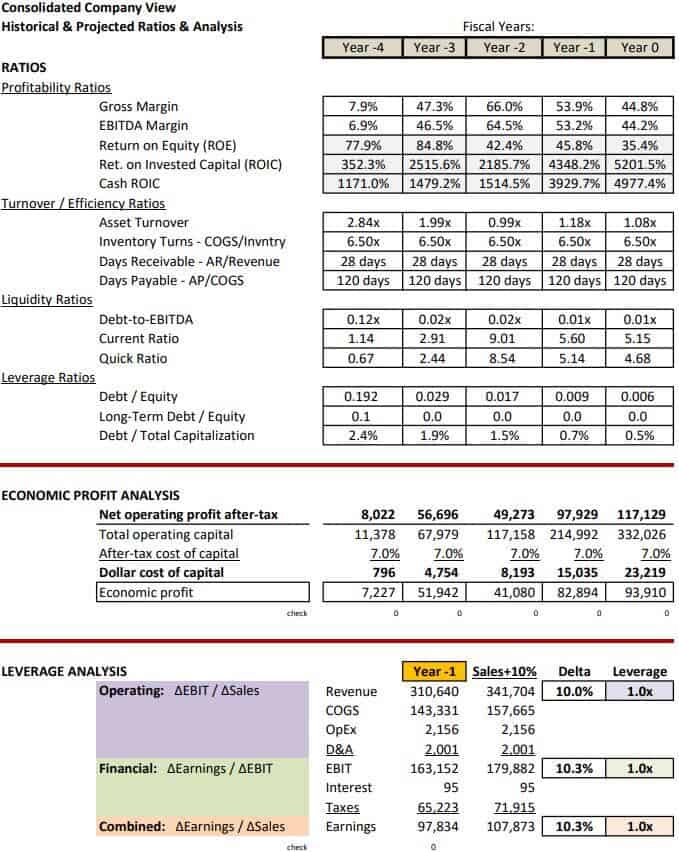
This production KPI excel dashboard supports its users to calculate all the essential production calls such as Total Manufacturing Costs or Cost of Goods Sold with a side-by-side analysis of Share Price, Book Value, and both Valuations. This is a demo version, but it is still better than the previous templates.
Key Features
- Handy to execute complicated calculations such as a calculation of Bottom-up Cost Capital
- Ability to store financial data for up to 5 years
- Financials for multiple business units and merged roll up
- Customization and build-out on an hourly or project basis
- Cleary-labeled input cells for calculation or labeling
Click here to download Manufacturer Business Model (DEMO).
3. Interactive Production KPI Dashboard
As the name says, this production KPI dashboard comes with an interactive UI. This KPI dashboard can show the various KPI’s side by side of different companies. It also shows these different variations in their different locations to make a modest comparison between them. This interactive dashboard supports different filters, e.g. months, revenue, etc. Also, this Interactive Production KPI gives the ability to monitor all important metrics of a business, for example, efficiency, Turnover rate, or a company’s profit.
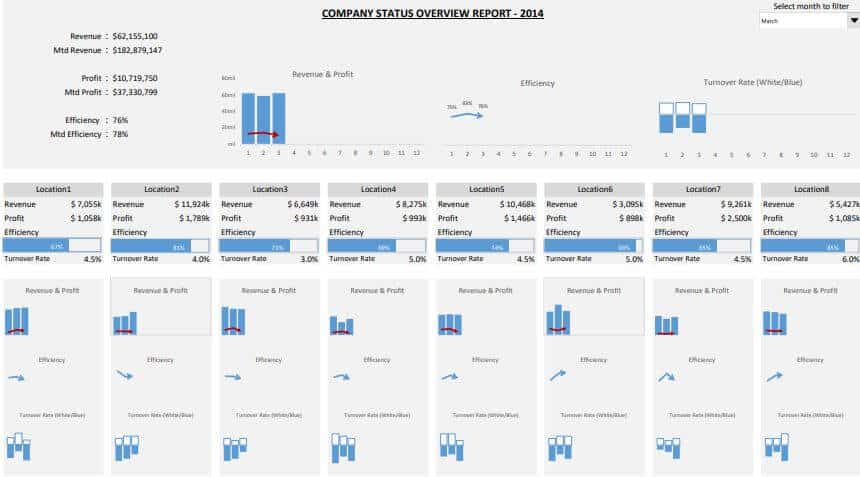
Interactive Production KPI Dashboard comes with some convenient customization features. The KPI name will automatically change when you change the content of cell A1 in each worksheet. Overall, it is an impressive production KPI dashboard to monitor essential business metrics without getting overwhelmed.
Key Features
- Ability to show KPI’s of Multiple companies
- Daily, weekly, and monthly performance estimate
- Fully customizable
- Easy to use even for beginners
- Simple and Clean UI
Click here to download the Interactive Production KPI excel dashboard.
4. Productivity KPI Templates
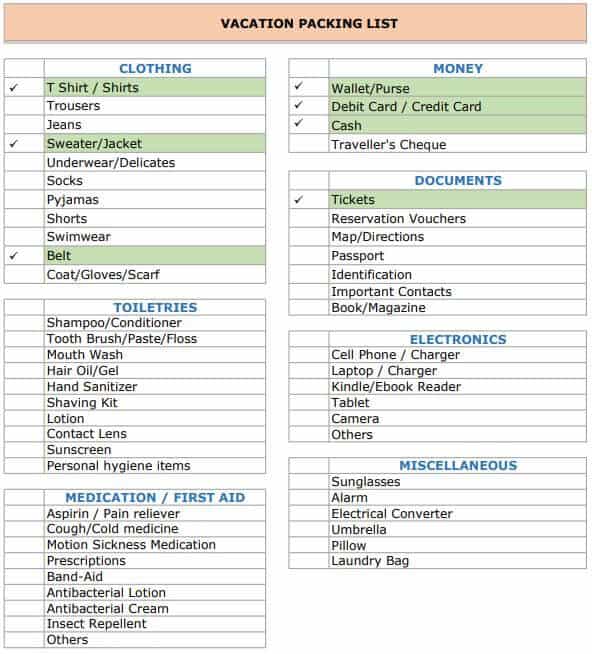
Well yes, in number 4 we are providing not a single template but a whole bundle of Productivity templates. These templates don’t have such complicated charts, tables or layout with calculation formulas. Hence you can’t compare these templates with previous feature templates. But it could be a blessing to a person who is totally a newbie in the world of Excel. And a person who wants to start a mid-sized business.
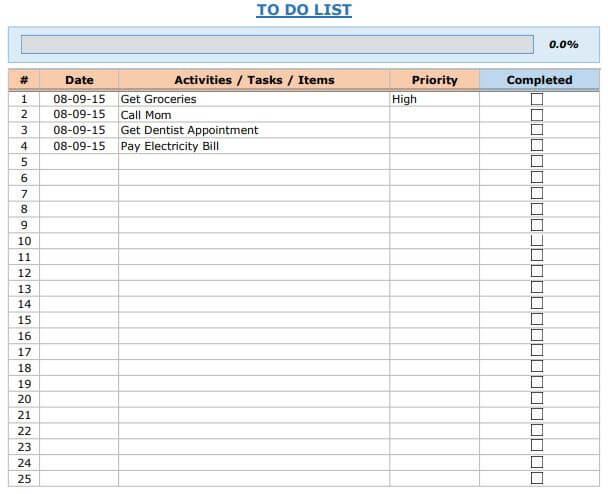
In this bundle, you’ll get 8 templates such as a To-do list with a checkbox, an Eisenhower table to prioritize tasks, and a shared expense calculator. This bundle also contains templates such as Calendar Integrated with To-Do List and Vacation Packing List Template. These templates can also be helpful to an office person, a student, or a traveler.
Key Features
- No complicated tables and formulas
- Easy to understand and Beginner-friendly
- Just print and go
- Convenient in daily life
Click here to download Productivity KPI Templates.
5. Cost of Goods Manufactured Excel Model Template
It is another simple and easy-to-use spreadsheet template by Eloquens. Cost of Goods Manufactured Excel Model can help you to monitor and schedule your business’ cost of goods manufactured. Costs of goods manufactured (COGM) is basically the total cost of manufacturing and producing goods ready to sell now.
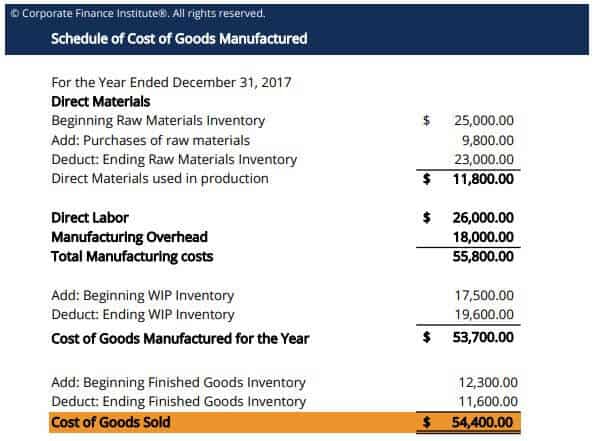
Besides COGM, this template allows you to calculate a yearly analysis of costs such as Direct Materials Used in Production and Total Manufacturing Costs. Above all, these calculations can tell a company’s revenue condition. As a result, this KPI Excel dashboard can be helpful to take important financial business decisions.
Key Features
- Provides essential financial information for your business
- Allows you to calculate important calculations, quickly
- One of the simple tools to calculate COGM
- Two-line calculations to understand them without overwhelming
- Calculate the yearly analysis of business revenue and profit
Click here to download the Cost of Goods Manufactured Excel Model Template.
6. Weekly Manufacturing KPI Dashboard
The weekly manufacturing KPI dashboard is another template to monitor business manufacturing activities on a weekly basis. Honestly, I like the animated dashboard and icons of this template. This shows all the metrics of different aspects of business in the speedometer and the icons similar to traffic lights.
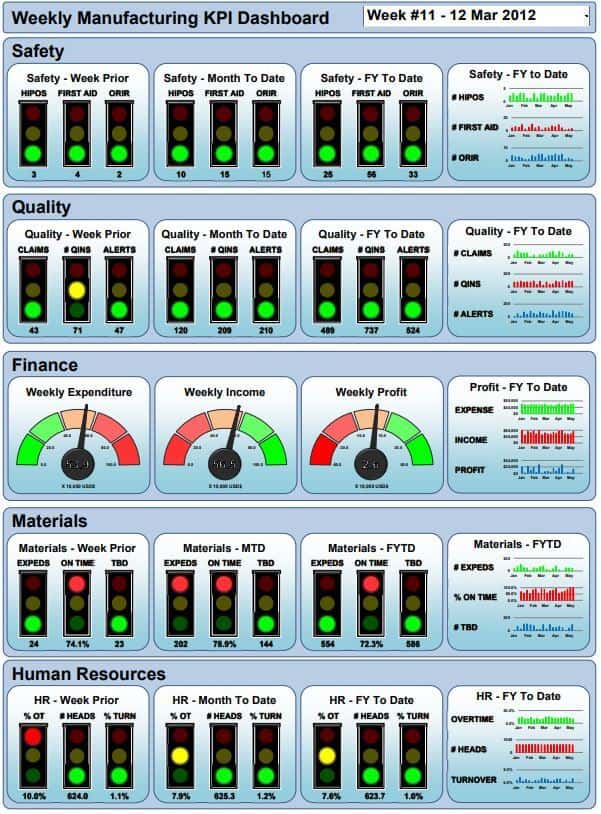
You can monitor activities such as finance, material, and material quality. Weekly Manufacturing KPI dashboard highlights the expenses, profit/loss, and income in the finance section. Above all, the user also can track all these metrics of a particular date of a week. You can download the locked version for free, but to access the unlocked version you have to buy a commercial license.
Key Features
- Weekly analysis of manufacturing costs and revenue
- Attractive and colorful animated User Interface
- Appealing and engaging Dashboard Icons
- Fully responsive layout
- The ability to Calculate the revenue/profit of a specific day
Click here to download Weekly Manufacturing KPI Dashboard
7. Manufacturing KPI Dashboard (Paid)
Manufacturing KPI Dashboard is the only paid KPI dashboard in our list of 7 best production KPI dashboard excel templates. If you’re serious about your business growth and want to follow metrics actively, then it is a must tool for you.
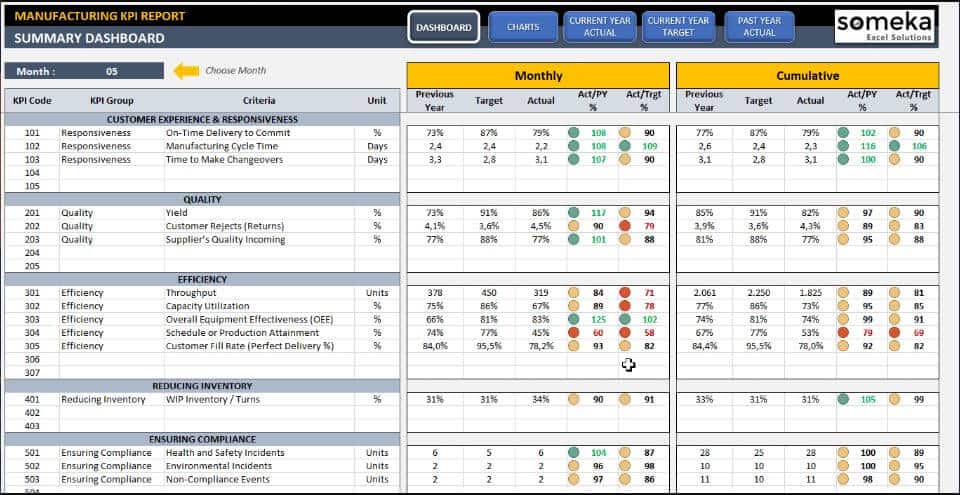
It gives you the authority to appraise those all-necessary metrics and take the action before they become a problem. Manufacturing KPI Dashboard is such a powerful tool that displays descriptive metrics, quantity changes, and presents them proficiently.
In addition, it allows users to add tables/graphs on a particular metric to achieve a monthly/yearly revenue target. With a 4.8/5 rating, Manufacturing KPI Dashboard costs a one-time payment of 39.95$ for a single user.
Key Features
- Periodic and Accumulative analysis
- Allow you to make Comparisons between Past year and Target Values
- Overview dashboard with interactional charts
- Straightforward on-sheet directives
- Excel 2007 (+ later versions) compatibility
- Compatible with Windows and Mac
- Ready-to-use. No download/installation is required.
Visit here to download Manufacturing KPI Dashboard
Get the suitable Production KPI dashboard Excel templates for your business
To sum up, production KPI dashboard Excel templates are useful to follow all the important production activities. Also, it is an ideal way to monitor your business growth in a particular period. I hope that these production KPI templates will help you monitor all important aspects of your startup or business.
Let us know in the comments if you find another useful template or have any tips regarding KPI dashboard excel templates. Also, don’t forget to share them with your friends and a person who is passionate to grow their business.

have to test working effectiveness of each template